
Psychrometric Chart (Mollier Diagram)
Follow us on Twitter

Question, remark ? Contact us at contact@myengineeringtools.com
| Section Summary |
|---|
| 1. What is a Psychrometric Chart? |
| 2. Interactive Online Calculator |
| 3. Psychrometric Chart Picture |
| 4. The Chart Explained |
| 5. Governing Equations |
1. Introduction
What is a psychrometric chart or Mollier Diagram ?
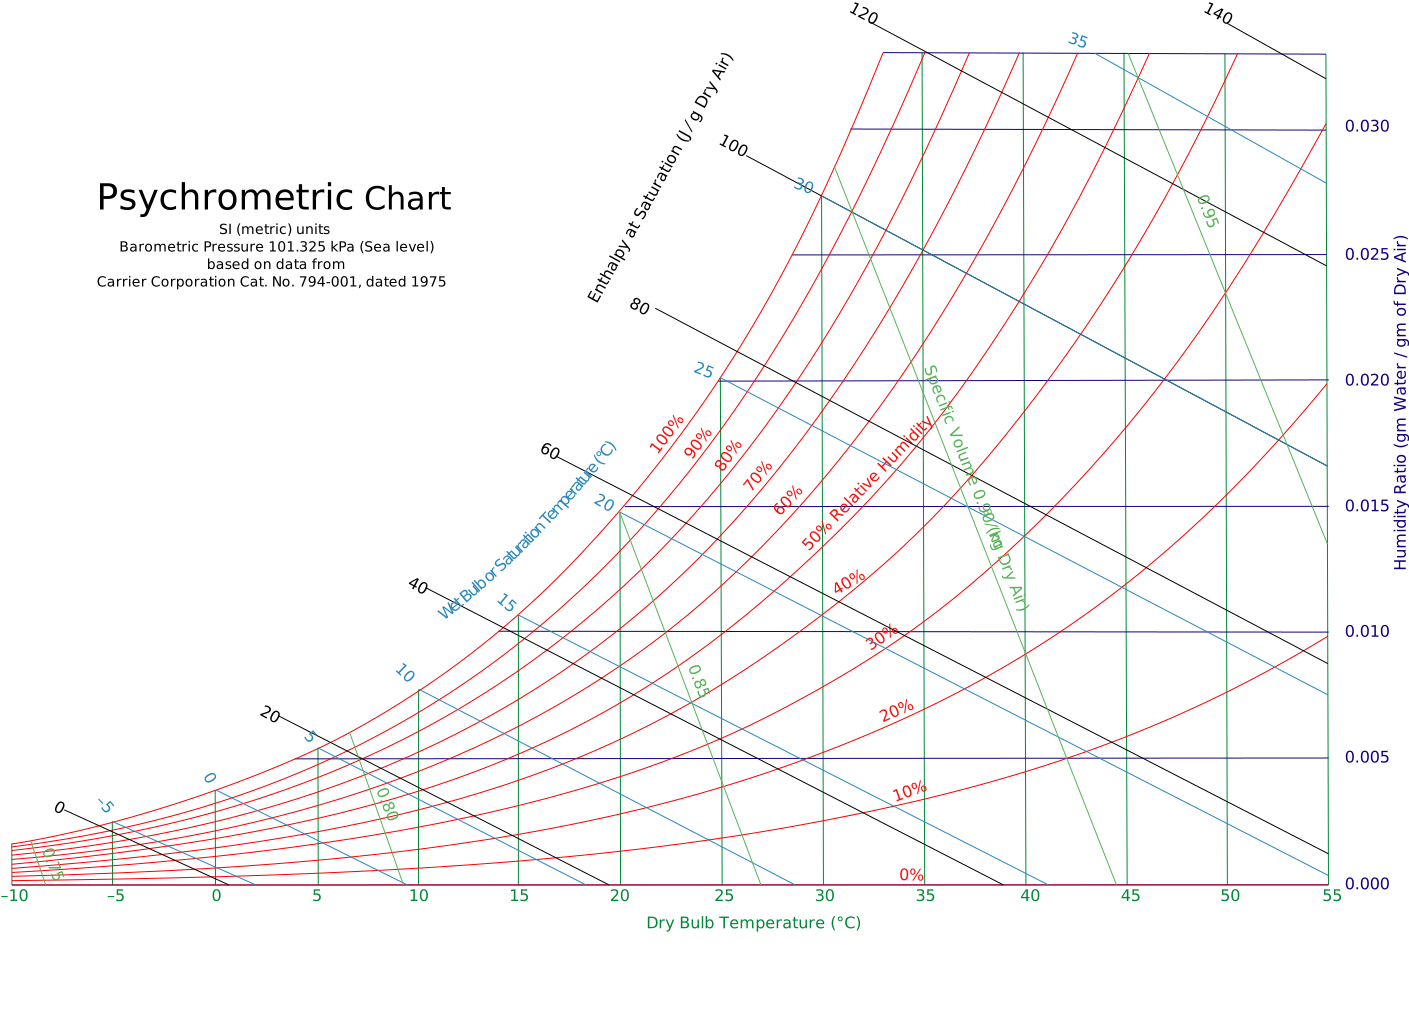
The psychrometric chart is used for all operations handling humid air. It relates dry bulb temperature, absolute humidity, relative humidity, and enthalpy. It is essential for HVAC design, drying operations, and cooling tower sizing.
Note: The Mollier diagram is functionally identical to the psychrometric chart but is mirrored and rotated by 90 degrees. Both provide the same thermodynamic state of the air-water mixture.
Air Property Calculator
2. Psychrometric Chart
The diagram below is based on SI units at sea level (101.325 kPa).
3. The Psychrometric Chart Explained
Each point on the graph defines a unique thermodynamic state of air:
| Dry Bulb Temperature: The actual air temperature measured by a standard thermometer. | 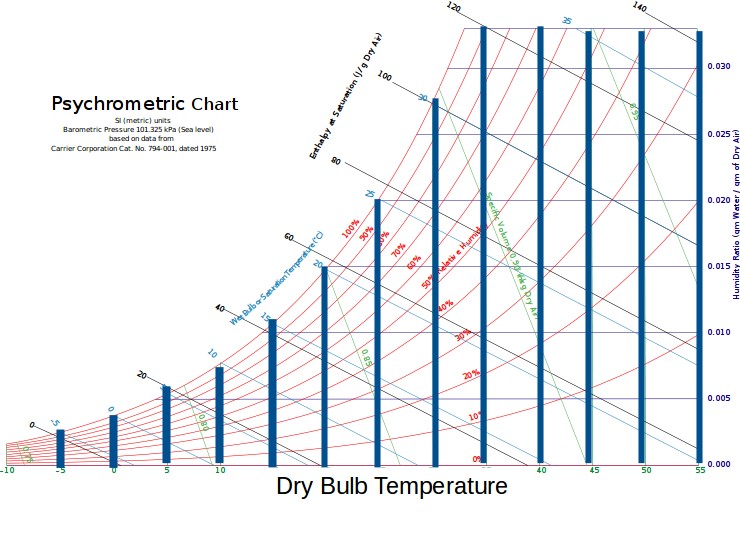 |
| Wet Bulb Temperature: The lowest temperature air can reach via evaporative cooling. |  |
| Dew Point: The temperature at which water vapor begins to condense into liquid. | 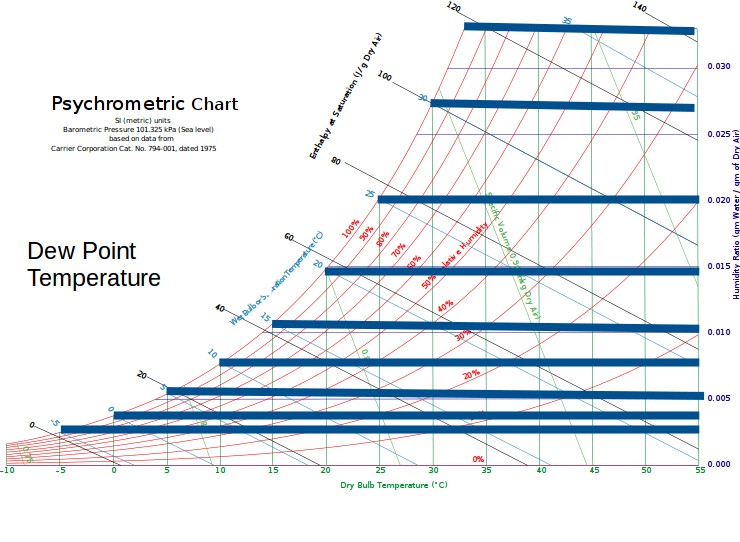 |
| Enthalpy: The total energy content of the air (Sensible + Latent). | 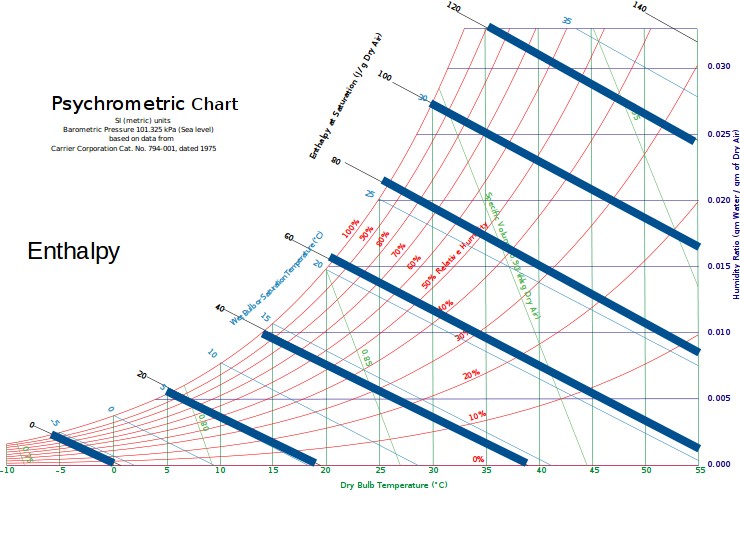 |
| Relative Humidity: The ratio of current water vapor pressure to saturation pressure. | 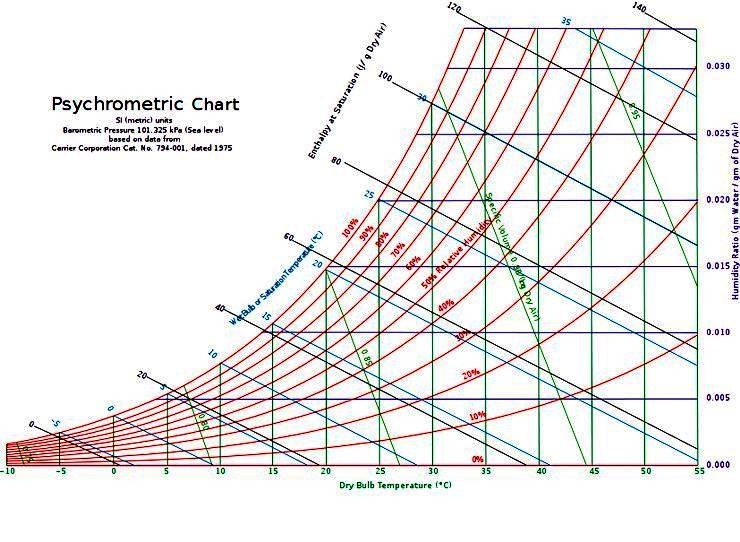 |
Industrial Rules of Thumb
- Standard Comfort: Target \(T_{db} \approx 22-24^\circ\text{C}\) and \(RH \approx 40-60\%\).
- Cooling Coil Design: Typical air leaves a cooling coil at \(90-95\% RH\).
- Pressure Sensitivity: Properties change significantly with altitude (lower pressure increases humidity ratio for the same RH).
- Process Drying: Raising air temperature lowers RH dramatically, increasing the "driving force" for moisture removal.
4. Governing Equations
The following equations are used to calculate the properties of humid air:
Where \(P_{ws}\) is the saturation pressure and \(T\) is absolute temperature (K).
\[ \omega = 0.62198 \cdot \frac{P_w}{P - P_w} \] \[ h = 1.006 \cdot t + \omega(2501 + 1.86 \cdot t) \]Note: The Specific Heat Capacity of dry air is assumed to be \(1.006 \text{ kJ/kg}\cdot^\circ\text{C}\).